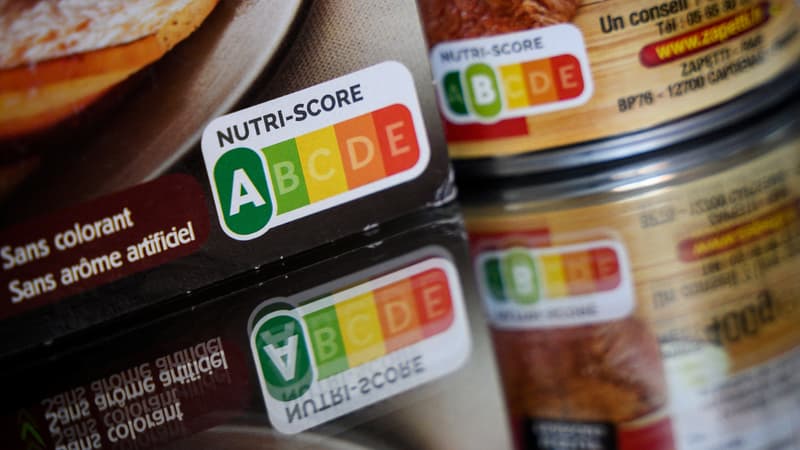
The Nutri-Score influences the purchases of the French. According to NielsenIQ data reported by LSA, consumers are increasingly sensitive to this note attached to certain packages to provide information about the nutritional quality of a product.
According to the panelist, the highest-rated products are generally those that perform best on the shelves, at least in certain categories. For example, sales of B-rated (second-best-rated) cooked and roast hams were up 12% in May year-over-year, while C-rated hams saw their sales drop 3% and those without a Nutri-Score a 13%.
The same is true of B-rated pizzas, quiches and fresh pies, whose sales increased by 8%, while those rated C (-2%) or D (+1%) underperformed. The situation is even worse for pizzas and quiches without Nutri-Score with a drop in purchases of 13%.
Sales of salads with an A and B grade plummeted 11%, but this is slightly less than the evolution of purchases of salads without Nutri-Score (-12%). Likewise, sales of sandwiches without a Nutri-Score fell 12% in May. On the other hand, the decline is much less pronounced for sandwiches with a Nutri-Score B (-4%) or C (-2%).
A quarter of food products display a Nutri-Score
In total, 26% of food products have a Nutri-Score on their packaging. This is 2 points more than a year ago.
However, there are significant disparities between departments. Thus, 54% of salty frozen foods, 40% of non-dairy fresh products, and 27% of salty grocery products have a Nutri-Score. In contrast, this only occurs with 19% of sugary edibles, 16% of non-alcoholic liquids, and 2% of alcoholic liquids.
Additionally, among Nutri-Score products, 47% have an A rating in the Savory and Frozen Savory Grocery categories, compared to 31% for Sweets, 23% for Fresh Dairy, 18% for fresh non-dairy products, 15% frozen sweets, 8% alcoholic liquids and 6% non-alcoholic liquids.
All categories combined, 31% of products have a Nutri-Score A, 24% a Nutri-Score B, 22% a Nutri-Score C, 17% a Nutri-Score D, and 7% a Nutri-Score -Score E.
Source: BFM TV


